October 26, 2026 · Kollavo Team
AI Citation Volatility: Why AI Sources Keep Changing and How to Measure It (2026)
AI citation volatility, measured: 56% of the domains Google AI Mode cites are new each week, and 74% in ChatGPT Search. Why sources rotate, how each engine differs, and four metrics to tell real drops from noise.
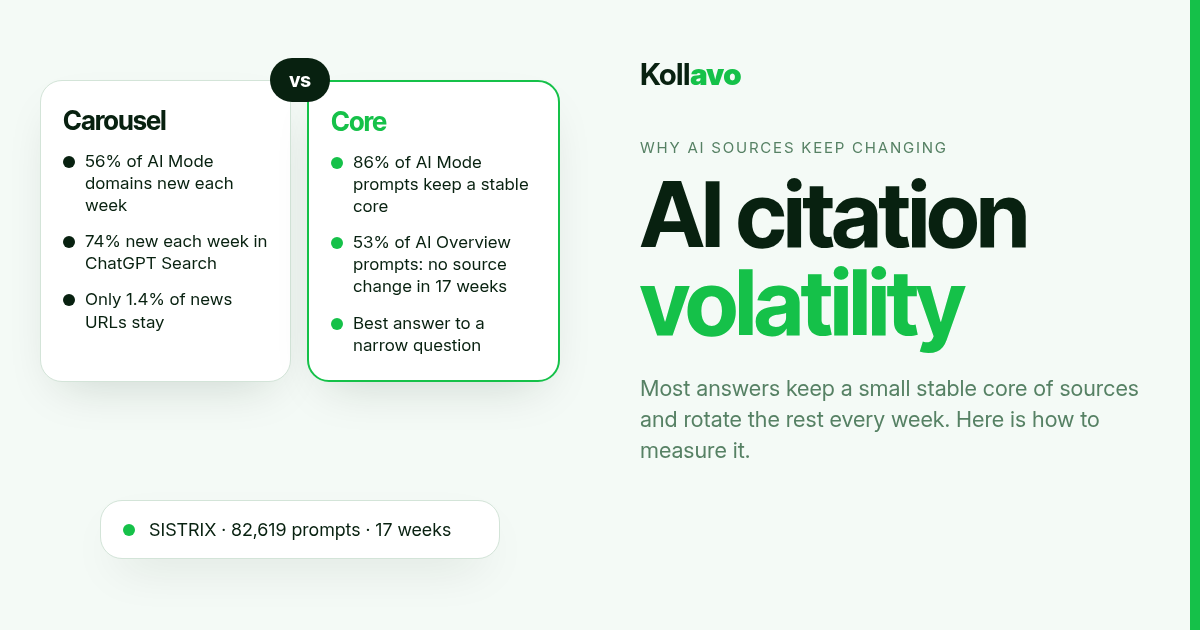
Short answer: AI citation volatility is how much the sources an AI engine cites change for the same prompt, from one run, day or week to the next. It is high. In SISTRIX data covering 82,619 prompts over 17 weeks, 56% of the domains cited in Google AI Mode answers were new each week, and 74% in ChatGPT Search. But volatility is not spread evenly: most answers have a small stable core of sources plus a rotating "carousel". Measure it as overlap, churn and a rate across repeated runs, then judge any drop against that normal noise before you react.
This guide explains what drives AI citation volatility, how it differs by engine, how to measure it with four simple metrics, and how to move your pages from the carousel into the core. If you are new to tracking, start with our guide to LLM citation tracking.
What is AI citation volatility?
An AI citation is a source link shown in an AI answer. Volatility describes how unstable that set of links is when the question stays the same. It shows up on three time scales:
| Time scale | What changes | Typical measure |
|---|---|---|
| Run to run (minutes) | Which brands and sources appear, and in what order | Overlap between two runs of the same prompt |
| Week to week | Which domains are cited for a prompt | Weekly churn-in and retention |
| Month to month | The wider pool of cited domains | Monthly drift |
Volatility is related to, but not the same as, citation decay. Decay follows one page or brand downward from its peak. Volatility is the up-and-down movement around a level, the noise you need to understand before you can tell whether a page is really decaying. Our article on LLM citation decay covers the decay side in depth.
How volatile are AI citations? What the research shows
Four studies, measured in different ways, point the same way: single snapshots are unreliable, but stable patterns do exist.
| Study | What was measured | Key finding |
|---|---|---|
| SparkToro and Gumshoe (January 2026) | 2,961 runs of 12 prompts on ChatGPT, Claude and Google's AI | Less than 1 in 100 chance of the same list of brands twice; about 1 in 1,000 for the same order |
| SISTRIX (May 2026) | 82,619 prompts, 3 platforms, 6 countries, 17 weeks | Weekly domain churn-in of 56% in Google AI Mode and 74% in ChatGPT Search |
| Profound (July 2025) | About 80,000 prompts per platform, June vs July 2025 | 40.5% to 59.3% of cited domains changed in one month; 70% to 90% from January to July |
| BrightEdge (February 2026) | Weekly citation share across 5 AI engines | 96.8% of cited domains saw no change week over week; 87% of changes were declines |
At first glance BrightEdge's 96.8% stability contradicts SISTRIX's 56% to 74% churn. It doesn't. BrightEdge measures each domain's overall citation share across thousands of prompts, which smooths out the noise. SISTRIX measures the source list of each individual prompt, where rotation is easy to see. Both describe the same system: a stable core, and a fringe that moves.
Run to run: answers are a lottery of candidates
In the SparkToro study, 600 volunteers ran the same prompts through ChatGPT, Claude and Google's AI. The lists changed in which brands appeared, in their order, and in how many were listed, from two or three to ten or more (SparkToro, January 2026). Their conclusion was that position in an AI list is meaningless, while the share of runs in which a brand appears is a useful measure. Leading brands in a category still appeared in a large share of runs.
Week to week: a fixed core and a carousel
SISTRIX found that 86% of Google AI Mode prompts had a stable core of a few domains, while 89% of the remaining domains rotated every week. The median ChatGPT prompt had no domain that appeared in all 17 weeks (SISTRIX, May 2026).
When citations change, they mostly fall
BrightEdge's weekly data adds the direction. Among the roughly 3% of domains whose citations moved, 87% declined and only 13% grew. Most changes were binary: a domain went from cited to not cited on a prompt, rather than fading slowly. Top-ranked brands were the most stable, with 99.4% of #1 and #2 mention positions unchanged (BrightEdge, February 2026).
AI citation volatility by engine
Engines behave very differently, so never average them into one number.
| Engine | Weekly behaviour (SISTRIX) | Monthly drift (Profound, 2025) |
|---|---|---|
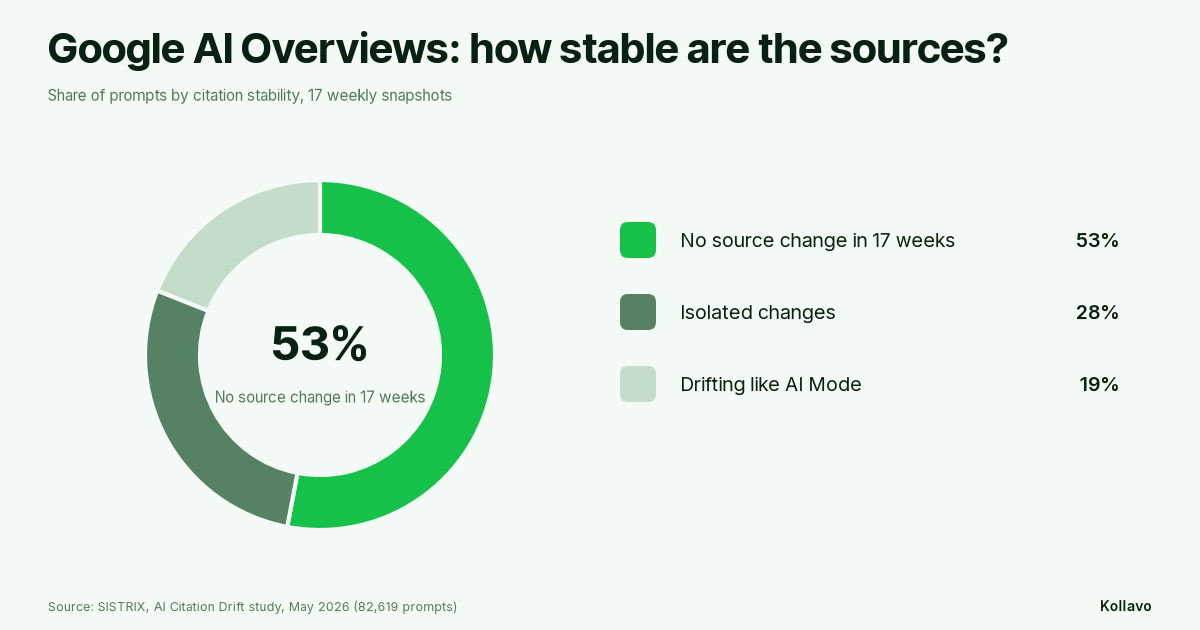
| Google AI Overviews | About 11 domains per answer, 8 of them stable; 53% of prompts never changed source in 17 weeks | 59.3% |
| Google AI Mode | 14 to 16 domains per answer; 56% new each week; median of about 2 core domains | Not measured |
| ChatGPT Search | 3 to 4 domains per answer; 74% new each week; no stable core for the median prompt | 54.1% |
| Perplexity | Not covered | 40.5% |
| Microsoft Copilot | Not covered | 53.4% |
Two things stand out. Google AI Overviews split into two groups: in SISTRIX's data, 53% of prompts kept exactly the same sources, 28% had isolated changes, and 19% rotated as much as AI Mode. And even Google's own surfaces disagree: AI Overviews and AI Mode cited different domains for the same prompt 83% of the time.
Use the Google AI citation tracker to see which domains Google's AI surfaces cite for your prompts, and the AI citation checker for a quick check across engines.
Why AI citations are so volatile
- Sampling. Language models generate each answer with controlled randomness, so wording, list length and the sources chosen vary between runs.
- Query fan-out. AI Mode and ChatGPT break a question into sub-searches. Small changes in those sub-queries pull in different pages each time. See what query fan-out is.
- Huge candidate pools. Many pages are "good enough" for a fringe slot, so they take turns. The best source for a question tends to stay.
- Freshness and news. SISTRIX found only 1.4% of news articles stayed in the stable core. Evergreen pages survived better.
- Pruning. BrightEdge saw engines dropping fringe citations without replacing them, tightening around fewer trusted sources.
How to measure AI citation volatility
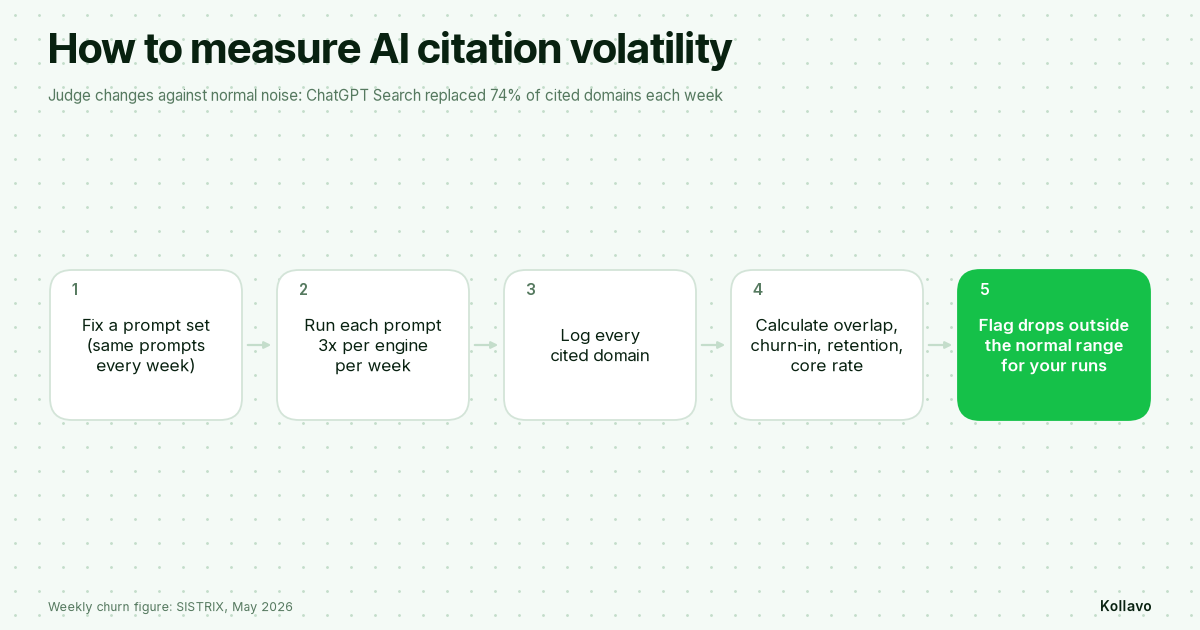
You don't need a data science team. Log every run of a fixed prompt set (see how to track LLM citation rate), then calculate four numbers per prompt and engine.
| Metric | Formula | What it tells you |
|---|---|---|
| Run overlap | Domains cited in both runs ÷ domains cited in either run | How random a single answer is |
| Weekly churn-in | New domains this week ÷ all domains cited this week | How fast the source list rotates |
| Weekly retention | Last week's domains still cited ÷ last week's domains | Whether your source survives |
| Core rate | Weeks your domain was cited ÷ weeks tracked | Core (cited most weeks) or carousel |
Churn-in and retention are the metrics SISTRIX uses, and it reports brand domains by whether they stay cited in at least 80% of weeks. A practical rule: call a domain core for a prompt when it is cited in at least 80% of tracked weeks, and carousel when it shows up less often.
Tell real drops from noise
Before you report "citations fell 6 points this week", check how big normal noise is for your sample. A citation rate is a proportion, so its noise depends on how many runs it is based on. As a worked example, with a true citation rate of 20%:
| Runs behind the rate | Normal range (about 95%) |
|---|---|
| 30 runs | ±14 points |
| 90 runs (30 prompts × 3 runs) | ±8 points |
| 180 runs | ±6 points |
| 360 runs | ±4 points |
So on 90 runs, a week at 14% after a week at 20% is inside normal noise. Two or three weeks below the range, or a drop on several engines at once, is a real signal. This is why weekly checks with three runs per prompt beat a daily single check: more runs per data point, and less chasing of noise.
How to reduce your exposure to citation volatility
You can't make AI engines deterministic, but you can move your pages from the carousel toward the core:
- Be the best single source for a narrow question. BrightEdge found domains cited on a few very specific prompts barely moved: those are cited because they are the best answer. Build pages that answer one buyer question completely, with a direct answer first, as in our AI citation optimization guide.
- Favor evergreen formats. Comparisons, how-tos and reference pages survive better than news. Link announcements into an evergreen page that can hold the citation.
- Get on the stable third-party sources. Core slots often go to Wikipedia, YouTube, marketplaces and specialist domains. Being listed on sources AI already trusts gives you a second route into the answer. Our guide on how to get AI mentions covers this.
- Pick an engine focus. With so little overlap between engines, optimize for the engine your buyers use most, and monitor the rest.
- Report rates, not snapshots. Use rolling 4-week citation rates and citation share against competitors, never a single screenshot of an answer.
How Kollavo helps
Kollavo tracks your visibility across ChatGPT, Perplexity, Gemini and Google AI Mode on repeated runs, shows your share of voice against competitors, and alerts you when competitors are cited where you aren't. Managed plans then get you listed on the sources AI already cites. Check your starting point with a free AI audit or the LLM visibility score, compare options on our comparison pages, and see pricing (Entry from $49/month).
FAQ
What is AI citation volatility?
AI citation volatility is how much the sources cited in AI answers change for the same prompt over time. It covers run-to-run variation, weekly churn and monthly drift. SISTRIX measured 56% weekly domain churn in Google AI Mode and 74% in ChatGPT Search.
Which AI engine has the most volatile citations?
Among the platforms SISTRIX studied, ChatGPT Search was the most volatile, with 74% of cited domains new each week, then Google AI Mode at 56%. Google AI Overviews was the most stable: 53% of prompts kept the same sources for 17 weeks. In Profound's 2025 monthly data, Perplexity drifted least (40.5%).
How do you measure AI citation volatility?
Run a fixed prompt set several times per engine each week and log the cited domains. Then calculate run overlap, weekly churn-in, weekly retention and your core rate (share of weeks you are cited). Compare any change with the normal noise for your number of runs.
Is AI citation volatility the same as citation decay?
No. Decay is a downward trend for one page or brand after its citation peak. Volatility is the fluctuation around a level, including normal noise. You need to know the volatility to tell whether a drop is real decay.
How often should I check AI citations if they are this volatile?
Weekly is a practical cadence for most brands, with each prompt run about three times per engine. Report rolling 4-week rates. Daily single checks mostly capture noise.
Can you stop AI citations from changing?
No, but you can make yours more stable. Pages that are the best answer to a narrow question, evergreen formats and listings on trusted third-party sources are more likely to sit in an answer's stable core.
Sources
SISTRIX, "AI Citation drift: How stable are sources in AI search results?" (Johannes Beus, published May 1, 2026, updated May 12, 2026; 82,619 prompts, 1,548,213 snapshots, December 17, 2025 to April 8, 2026). Rand Fishkin and Patrick O'Donnell, "AIs are highly inconsistent when recommending brands or products", SparkToro (January 2026; 600 volunteers, 12 prompts, 2,961 runs). Profound, "AI Search Volatility: Why AI search results keep changing" (July 17, 2025; about 80,000 prompts per platform). BrightEdge, "AI Search Citations: How Much Do They Really Change Week to Week?" (February 6, 2026; week of February 1, 2026). The noise ranges in the measurement section are a standard 95% interval for a proportion, calculated by Kollavo as a worked example. All sources checked October 26, 2026.